Health data are constantly stored in different registers of various data controllers, for example, in the hospital database every time a patient visits the hospital. These data are of course highly sensitive and thus they are regulated with different national and international legislation, such as the European General Data Protection Regulation (GDPR). However, health data are also really valuable as they enable, for example, to study and find early risk factors for cancer, to develop individual and more effective treatments, and to accelerate patient access to treatment. Therefore, generating synthetic data from the real-world data (RWD) could rectify the current under-utilization of patient data without compromising patient privacy and safety.
Health data, particularly patient data, are longitudinal in nature as new data are stored every time a patient, e.g., visits the hospital or uses its services otherwise. In longitudinal data, the observations are not independent by definition, and in order to preserve their temporal structure, special attention must be paid while synthesizing data. Various different methods have been used to generate synthetic longitudinal data, and in my master’s thesis, I selected the PrivBayes method for my approach. The method uses Bayesian networks, an example of which is given in Figure 1, to capture the dependency structure of the data and utilizes the network to generate synthetic data. The hypothesis was, that the Bayesian network would capture the correlation structure present in the longitudinal data and therefore preserve the temporal structure of the observations.
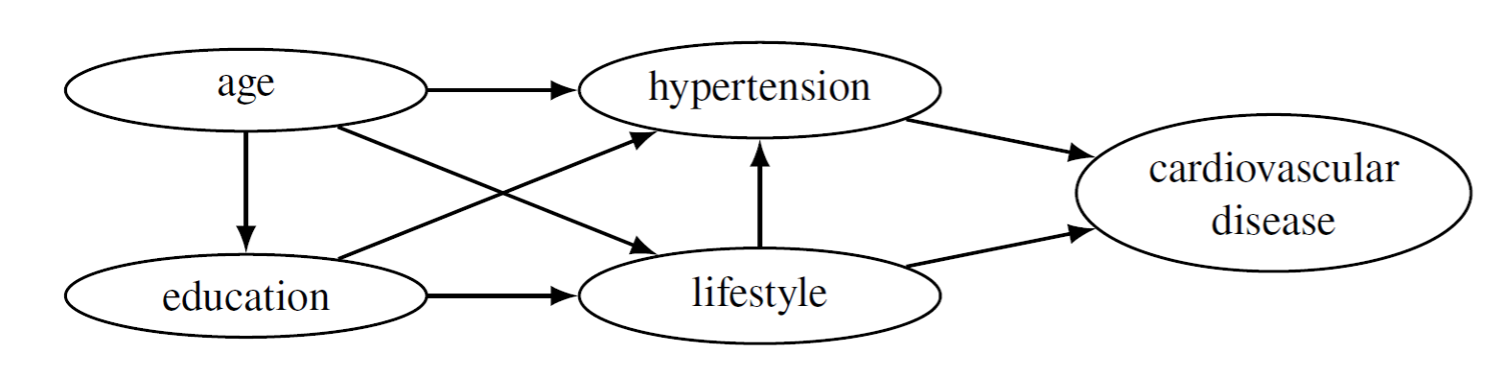
Figure 1: A Bayesian network over five attributes. The network illustrates the conditional dependencies between the attributes. If there is an edge between two nodes, say, for example, from hypertension to cardiovascular disease (CVD), it means that CVD is directly dependent on hypertension. If there is a path but no direct edge, e.g., from age through hypertension to CVD, that means that CVD is conditionally independent from age, given all other nodes on which the CVD directly depends, i.e., hypertension and lifestyle.
The original data set used in the data synthesis consisted of 2890 individual patients diagnosed with either type 1 or type 2 diabetes and seven different characteristics collected for each patient: age, body mass index, complications related to diabetes, gender, type of diabetes and two measurements for glycated hemoglobin that represented the repeated measurements in the data. This data was used to generate 27 different synthetic data sets to evaluate the PrivBayes method. The evaluation of the generated synthetic data was divided into three categories: methods that measure the overall similarity of the probability distributions, methods that evaluate the validity of statistical inference, and methods that measure the privacy of the synthetic data. However, only the first two were used in the thesis.
Unfortunately, the PrivBayes method did not produce synthetic data of sufficient quality to be applicable as such to the synthetic data generation of real-world longitudinal patient data. However, the results provided more detailed information on which areas require further research and development. In addition, the results of my thesis supported the previous conclusion as to why synthesizing longitudinal data is particularly challenging: the method was able to maintain the univariate distributions reasonably well but not the temporal order between the repeated measurements, as illustrated in Figure 2. The lack of temporal order was also reflected in the results of the linear mixed-effects model, the method used to measure the validity of statistical inference in the thesis.
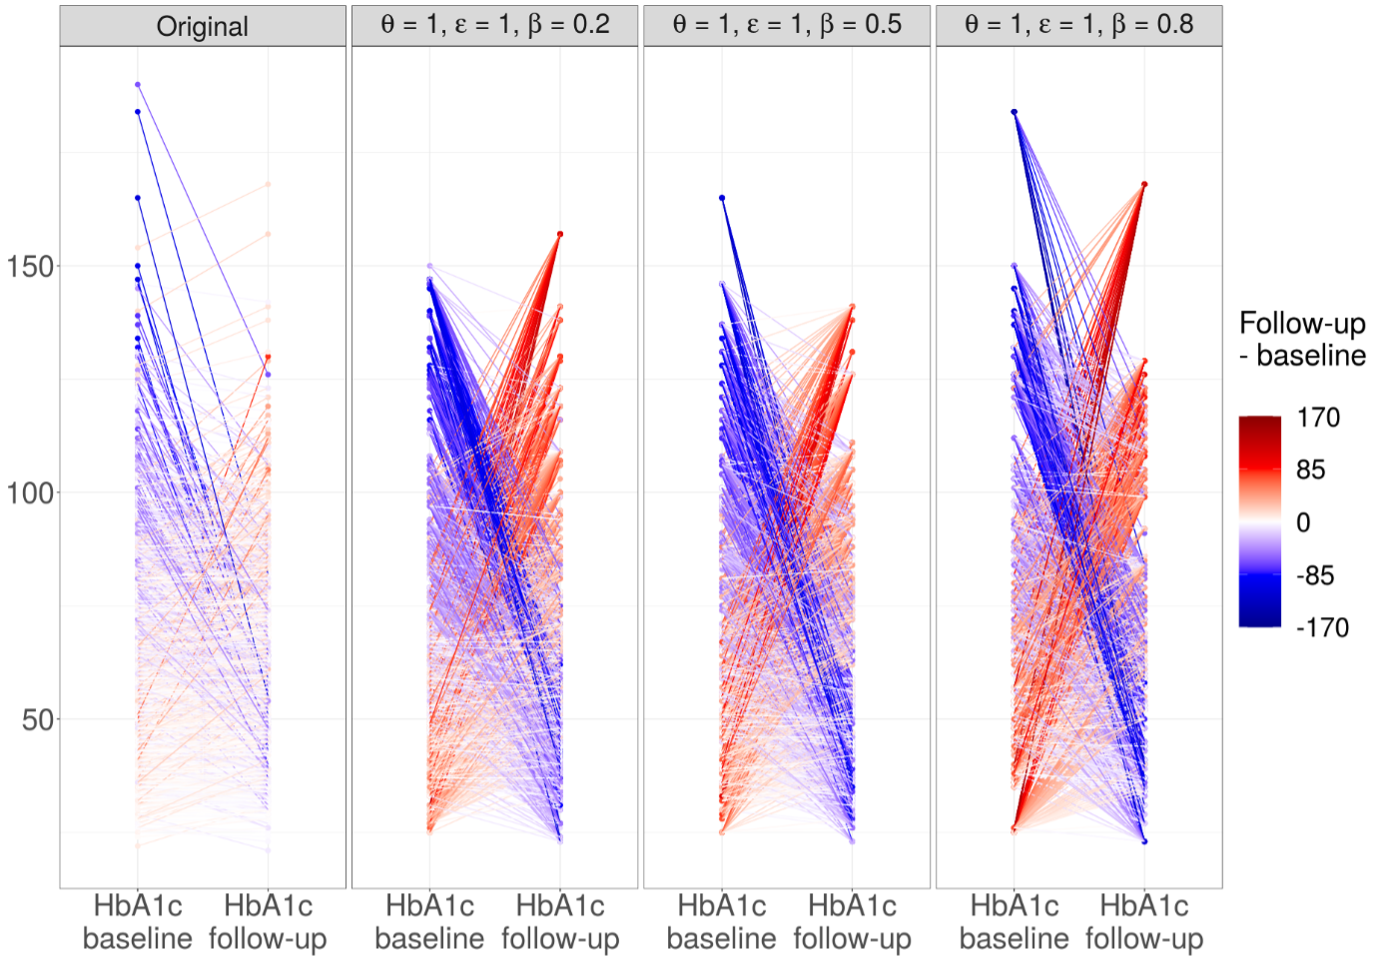
Figure 2: The individual trajectories are plotted in the figure so that the color of the line indicates whether the value has decreased (blue) or increased (red) from baseline to follow-up. The whiter the graph, the more similar the repeated measurements, which can also be interpreted as the correlation between the measurements. The headings in the sections of the figure indicate whether the data is original or synthetic, and in the latter case, the values of the hyperparameters used to generate the data are given in the heading.
The next steps in generating synthetic longitudinal patient data are:
• to conduct a systematic literature review of existing methods in order to identify and critically discuss the methods, their limitations, and challenges;
• to design and validate an evaluation framework to assess the utility and privacy of synthetic longitudinal patient data;
• to evaluate a selected set of methods based on the results of the literature review by generating synthetic longitudinal patient data from RWD and using the evaluation framework;
• to develop a new improved method based on the evaluation of the existing methods and test the method with the evaluation framework.
These steps will be part of my postgraduate studies, which are scheduled to begin in 2021. For those of you who may be interested in reading my master’s thesis in more detail, click the link below the cover of my thesis:
http://urn.fi/URN:NBN:fi-fe20201223102827
Thank you for reading the summary and if you are more interested in the topic, please feel free to contact me!